I have been spending quite a bit of time recently thinking about the role of data analytics in consulting. When I look at how business decisions are made, I am not sure that the availability of more data has always resulted in better decisions. That got me thinking about what the role of data analytics should really be in consulting.
For sure data has become much easier to access. Businesses have more systems, more information and more dashboards than ever before. AI has made analytics capabilities have also become far more sophisticated.
Data Analytics provides a leadership team better understanding of a business problem, a clearer view of the choices available to them and greater confidence that the decision they are making will lead to the outcome they want.
It can help us understand the problem, test our thinking, make choices and, once a decision has been made, track whether the business is actually moving in the expected direction.
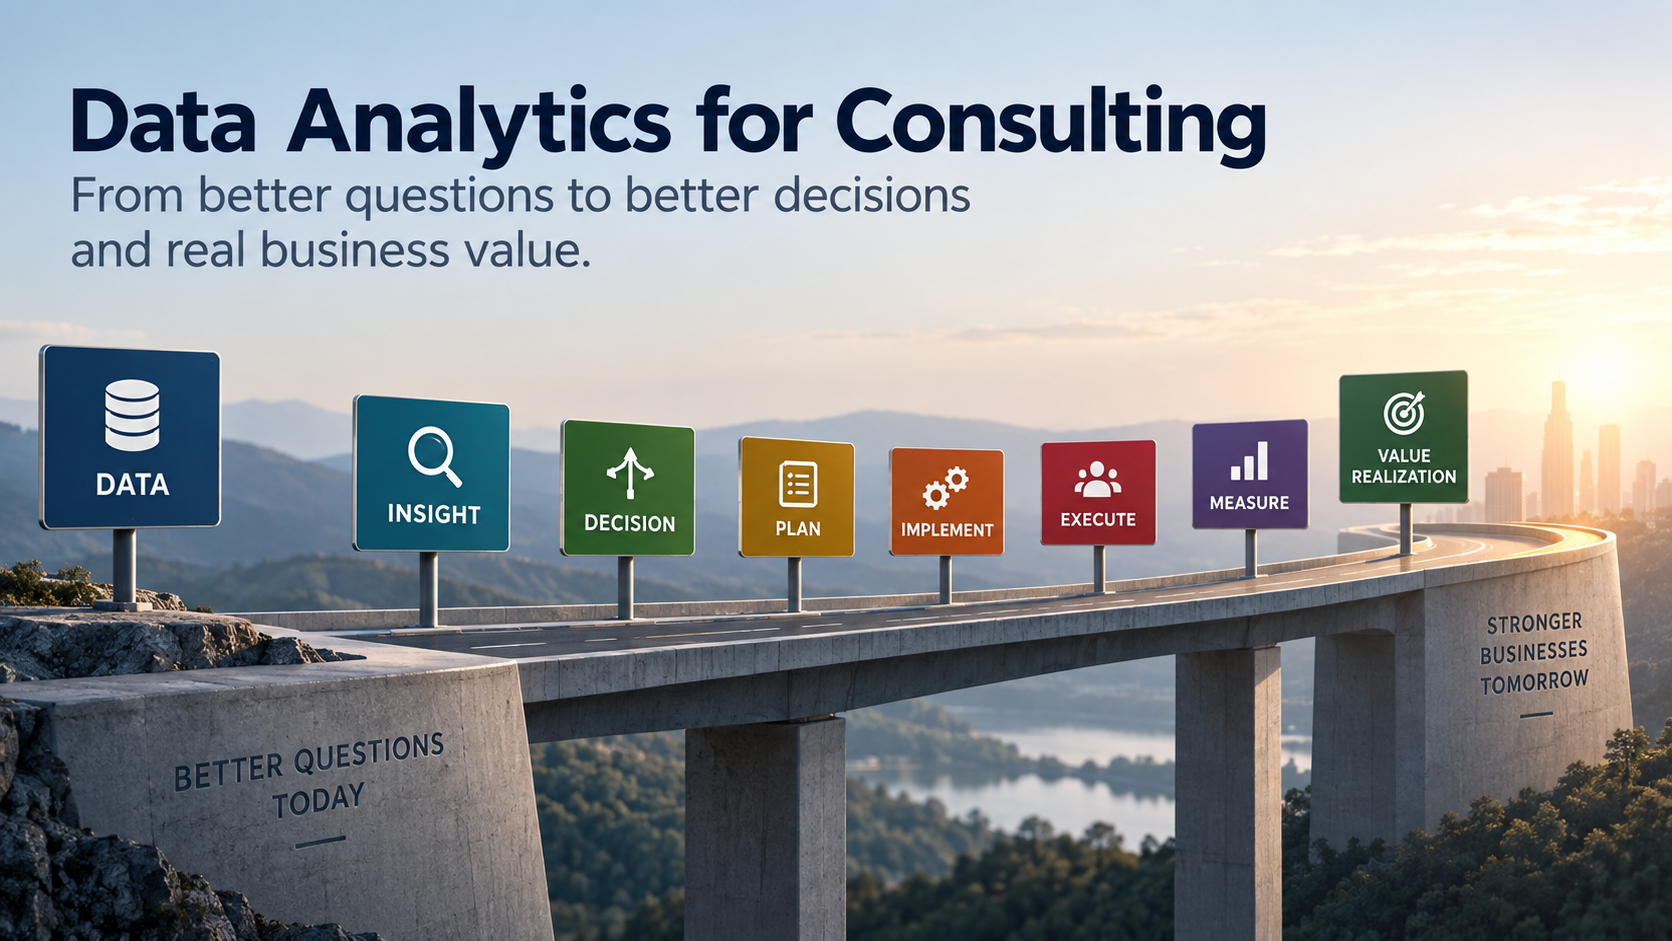
In other words, I see a connection between Data, Decision, Implementation, Execution and Value.
Data does not automatically make a decision better
I have always found that phrase “organisations becoming data-driven” very interesting.
Imagine a business with hundreds of reports, multiple dashboards and years of customer, sales, operational and financial data. The organisation certainly has a lot of information available to it. But what happens when the leadership team has to make an important decision?
- Which market should we enter?
- Which customer segment should we focus on?
- Where should we invest?
- Why are margins falling?
- Should we build capacity or improve utilisation of what we already have?
- Should we launch the new product now or wait?
These are not data questions alone. They are business questions. Data can help answer them, but only if we know what we are trying to understand. That is why I believe the starting point for analytics in consulting should be the business problem, rather than the data itself.
Here are 8 questions that i believe captures the essence of data analytics for organizations strategic decision making.
Question 1. Are we solving the right problem?
Take a company whose revenue has declined by 10%. The immediate reaction could be to ask how the company can increase sales.
But that may not be the real problem.
Perhaps the company is acquiring customers at the same rate as before, but losing more existing customers. Perhaps one product category has declined while the others continue to grow. Perhaps one geography is responsible for most of the decline. Perhaps the sales team is generating enough leads but conversion has fallen.
The overall number tells us what happened. We need to understand what is behind it.
This is where analytics can make a real difference.
We can break the problem down by customer, product, geography, channel, salesperson or time period. We can look for patterns and relationships. We can compare what is happening today with what happened previously.
The objective is to move from a broad observation to a better understanding of the actual problem, because the intervention will depend on what we find. If the problem is customer acquisition, we may need a different response from what we would do if the problem is customer retention.
The better we understand the problem, the better the decision that follows.
2. What outcome are we actually trying to create?
Once we have a clearer view of the problem, we need to decide what we want to change. This is where I think the connection between analytics and Business Value becomes important.
Suppose the leadership team says, “We want to improve customer retention”. That is a reasonable objective, but it still leaves several questions unanswered.
- How much improvement are we looking for?
- What does that improvement mean financially?
- Are we trying to protect revenue? Improve customer lifetime value? Increase contribution margin? Reduce the cost of replacing lost customers?
The same applies to productivity.
A company may say it wants to improve productivity, but there are several ways to define that outcome. It could mean
- Producing more with the same resources,
- Reducing the resources required for the same output,
- Improving capacity utilisation or reducing the cost of delivering a service.
The definition of the outcome changes the analysis. It also changes the choices available to us.
This is why I would put Business Value fairly early in the analytics conversation. Before we start building models, we should understand what improvement we are trying to create and why that improvement matters to the business.
3. What are the different ways we could achieve that outcome?
Once the desired outcome is clear, the next step is to look at the choices.
Let’s take revenue growth as an example.
A company could grow revenue by acquiring more customers. It could improve conversion rates. It could reduce churn. It could increase prices. It could sell more products to existing customers. It could enter a new customer segment or launch a new product.
These are very different strategies.
Each one requires different investments and capabilities. They also carry different levels of risk and have different time horizons.
Analytics can help us compare them.
We can use historical data to understand what has worked in the past. We can analyse customer behaviour to identify opportunities. We can model different scenarios and understand how the economics change under different assumptions.
Instead of saying, “I think this is the best option,” the leadership team can ask, “What does the evidence tell us about the different options available?”
The final decision will still require judgement. But the judgement is now being applied to a better-informed set of choices.
4. Does the economics of the plan make sense?
- How much are we going to invest?
- What do we expect to get back?
- How long will it take?
- What assumptions are behind the business case?
- What happens if the benefits are lower than expected?
Imagine a company considering a ₹50 crore investment in a transformation programme.
The expected benefit may look attractive on paper. But
- How much of that benefit comes from revenue growth?
- How much comes from cost reduction?
- When will those benefits appear?
- Which assumptions have the biggest impact on the business case?
Sensitivity analysis can show which assumptions matter most. Scenario analysis can help us understand different possible outcomes. Historical data can help us test whether some assumptions are realistic.
This is particularly useful when there are several competing investments. The question is not simply whether we can afford a particular initiative. We should also ask whether it represents the best use of the capital, people and management attention available to us.
5. Can the organisation actually execute the plan?
This is where the conversation starts moving beyond analytics and into execution. A business case can be compelling and the strategy can be sound. But someone still has to make it happen.
- Do we have the right people?
- Do they have the required skills?
- Are the resources available?
- What other initiatives are competing for those resources?
- Are there dependencies on technology, vendors or other business units?
- How much change can the organisation absorb at the same time?
These questions often appear later, once a programme has already started. I think they should appear much earlier.
For example, imagine an organisation launching five transformation initiatives, all of which require significant support from the same technology team. Each programme may look achievable when considered individually. Together, they may be impossible to deliver within the planned timeframe.
Data can help make these constraints visible.
We can map resource utilisation, programme dependencies, historical delivery performance and capacity requirements. We can understand where the organisation is likely to face bottlenecks.
This is also where I see a natural connection between Data Analytics and Program Management.
- Analytics helps us understand the situation and test the plan.
- Program management helps us organise the work, manage dependencies, allocate resources and keep the organisation moving towards the intended outcome.
The two disciplines can work much better together when they are connected from the beginning.
6. What happens when our assumptions change?
Every business plan is built on assumptions.
Customer demand may change. Costs may increase. Competitors may respond. A new technology may take longer to implement. A product launch may be delayed. Market conditions may move in an unexpected direction.
We cannot eliminate uncertainty. But we can understand it better.
Suppose a growth plan assumes that customer acquisition will increase by 20%.
- What happens if the increase is only 10%?
- What if customer acquisition costs rise by 15%?
- What if the new product takes another six months to launch?
- Which of these changes would materially affect the business case?
These are useful questions because they help us understand where the plan is most vulnerable. Analytics can help us run these scenarios before the organisation commits significant resources. It can also help us identify the indicators that we should watch once execution begins.
This becomes particularly important when the time horizon is long.
A three-year strategy may be appropriate for building a new capability, but we shouldn’t have to wait three years to know whether we are moving in the right direction. We need to identify what we should see in six months, twelve months and eighteen months if the strategy is working.
7. How will we know whether the plan is working?
This is where the role of analytics changes.
Before the decision, analytics helps us understand and choose.
Once the plan is underway, analytics helps us understand whether reality is following the plan.
- A programme may have completed all its planned activities.
- The technology may have been delivered.
- Training may have been completed.
- The new process may have been launched.
- The project dashboard may show green.
But what has actually changed in the business?
- Are customers using the new product?
- Has conversion improved?
- Has productivity increased?
- Has cost-to-serve reduced?
- Has customer retention improved?
- Is the expected financial benefit appearing?
These are different measures. Some tell us whether activities are happening. Others tell us whether operational performance is changing. Ultimately, we need to know whether the business outcome and the expected value are being created.
This is where analytics can become an important part of Value Realization.
We can establish the expected value at the beginning, identify the operational indicators that should lead to that value and then track what actually happens.
This provides leadership a much better view of whether the strategy is working.
8. How are we performing compared with the world outside?
There is one more question that is easy to miss. Businesses naturally compare themselves with their own past.
- Revenue has grown.
- Margins have improved.
- Productivity is higher.
- Customer retention is better.
All of these can be good signs. But what happened in the market during the same period?
If our revenue grew by 8% while the market grew by 15%, we have improved but lost relative position.
If our productivity improved by 5% while competitors improved by 10%, the picture is different again.
External data therefore becomes important. Market growth, competitor performance, customer behaviour, pricing and industry benchmarks can all change the way we interpret our own performance. A business can be improving and still be falling behind.
Analytics gives us the ability to see both.
The difference between reporting and analysis
There is another distinction that I think is important in consulting.
Suppose the CEO receives a report saying that revenue has fallen 7%. That is useful information. The next level is understanding what caused the decline. Perhaps new customer acquisition is down 12%, while existing customer revenue is stable. Perhaps most of the decline is concentrated in one customer segment.
That is analysis.
But consulting needs to take the conversation further.
What should we do about it?
Perhaps the analysis shows that the declining segment also has the lowest customer lifetime value and the highest acquisition cost.
Now the conversation changes.
We may decide that the answer is not simply to generate more sales. We may decide to redirect resources towards a different segment. That is where data moves from reporting to decision support. And that is where I believe much of the value of Data Analytics for Consulting lies.
Analytics has a role before and during the project
We usually think of analytics as something that happens when we want to understand business performance. But, it can play an equally important role before a programme starts.
Imagine a company preparing a large transformation programme. Analytics can help answer questions such as:
- Where exactly is the value opportunity?
- Which value drivers matter most?
- Which business units or customer segments contribute most to the opportunity?
- What assumptions are behind the business case?
- Which initiatives contribute most to the expected value?
- What resources will be required?
- Where are the major dependencies?
- What happens if implementation takes longer than expected?
This makes analytics part of programme design. Then the programme starts. The questions change.
- Are the initiatives progressing?
- Are the planned changes actually being adopted?
- Are operational indicators moving?
- Are business outcomes improving?
- Is the expected value appearing?
- Where is value leaking?
Now analytics becomes part of programme management and execution. The data is still important, but the questions have changed.
The Analytics-to-Value Gap
This leads to an idea that I think is worth exploring further.
There can be a significant gap between producing analytics and creating value from analytics.
A company can spend ₹50 lakh on an analytics project and end up with sophisticated models, dashboards and reports. But none of those things are business value by themselves. The value comes when the analysis changes a decision. Then that decision changes something in the business. And that change produces an outcome.
For example:
Data tells us that customer churn is increasing.
Analysis tells us which customers are leaving and why.
Decision identifies a different retention strategy.
Implementation puts the new approach in place.
Execution changes how customers are managed.
Measurement shows whether churn is actually falling.
Value Realization tells us whether the revenue and margin benefit we expected has actually appeared.
That is the journey that interests me. The analytical model is only one part of it.
From Data to Decision to Value
When I look at all of this together, I see a fairly simple journey:
Data → Insight → Decision → Plan → Implementation → Execution → Measurement → Value Realization
Each step matters.
The quality of the data matters.
The quality of the question matters.
The quality of the analysis matters.
The quality of the decision matters.
The ability to implement the decision matters.
The quality of execution matters.
And finally, our ability to measure the outcome matters.
A weakness at any point can reduce the value created at the end. This is why I don’t see Data Analytics as a separate capability sitting somewhere inside an organisation.
Used well, it can become part of the way a business thinks. It can help leadership understand problems more clearly, make choices with better evidence, design more realistic programmes and manage execution with better information.
And when connected to Value Realization, it gives us a way to keep asking a very important question: Is the work we are doing actually creating the value we expected?
What does this mean for consulting?
For me, this changes the role of analytics in consulting. The consultant’s job is not simply to analyse data and present the findings.
The work starts with understanding the business problem. Analytics helps us investigate that problem, quantify the opportunity, test different choices and understand the assumptions behind them.
- The decision then has to become a plan.
- The plan has to become an implementation.
- Implementation has to become execution.
- And execution has to produce the intended business outcome.
That is where I see Data Analytics connecting naturally with the broader work we are building at TwoBees. Our interest has always been in the journey from Business Ambition to Business Value.
Analytics can help us understand the value opportunity.
- It can help identify the drivers of that value.
- It can help identify where value may be leaking.
- It can help us choose the right intervention.
- And once the intervention is underway, it can help us understand whether the business is actually moving towards the intended outcome.
That creates a much broader role for analytics. It sits between the question we are trying to answer and the action we eventually take. And perhaps the most useful way to think about Data Analytics for Consulting is therefore not:
“What does the data tell us?”
But:
“What should we do differently because of what the data tells us. And how will we know that it worked?”
That is where data becomes more than information. It becomes part of the journey from decision to execution to value.
Leave a Reply